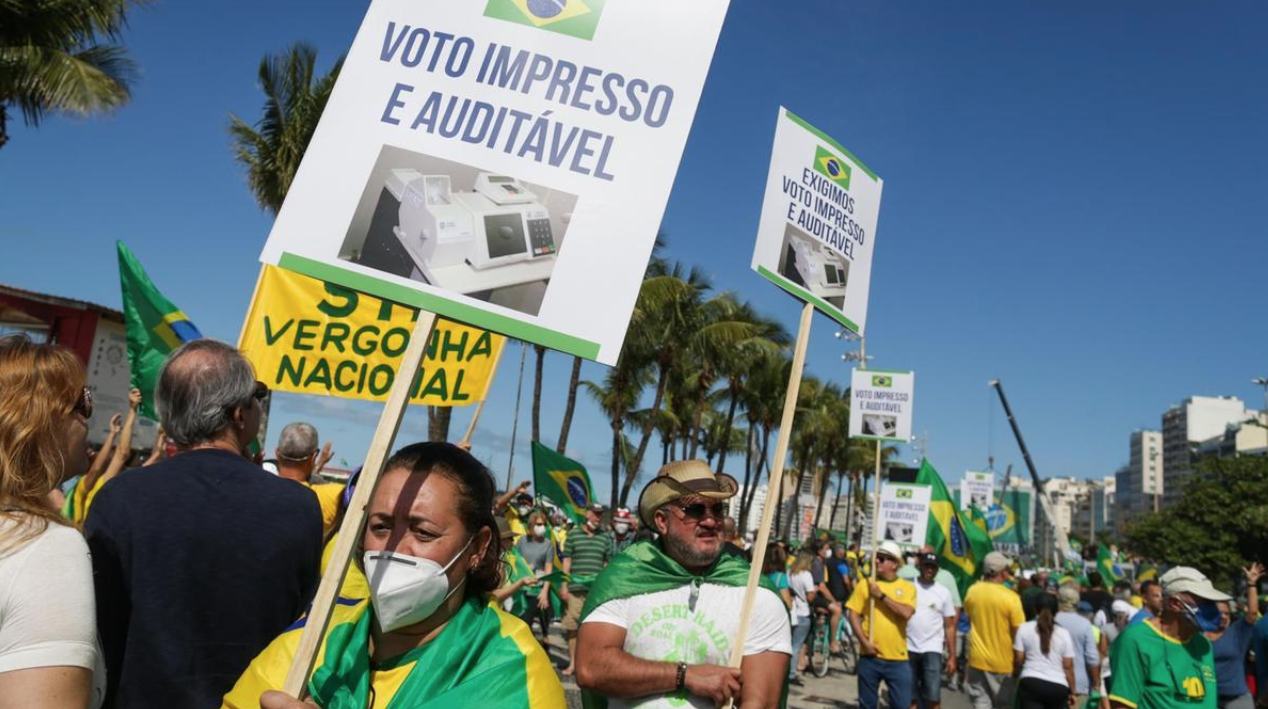
The subject of this text is delicate and dangerous to the point that it has become one of the taboos of our society. We are not talking about hunger, as Josué de Castro did. We are talking about the delicacy of the only government regime capable of resolving conflicts without the need for physical violence: democracy. According to Our World in Data, 7 out of 10 people live in autocratic systems, where it is not possible to choose political representatives from free and fair elections. In this article, we argue that the Brazilian presidential elections of 2022 were neither free nor fair. There is strong evidence that the incumbent candidate, Jair Bolsonaro, used government institutions politically and abused economic power in order to obtain electoral benefits. In addition, he was intentionally degrading the population’s confidence in the vote-counting system.
On October 29, Silvinei Vasques, director of the Federal Highway Police (PRF) called for votes for Bolsonaro on social networks. The following day, the PRF launched 549 vehicle inspection operations across the country, representing a 70% increase over the first round. During the inspections, 610 public transport vehicles were stopped, despite the prohibition of the Superior Electoral Court. Most of the operations took place in the Northeast region, the main electoral stronghold of the Workers’ Party (PT) and the only region where Lula obtained more votes than his opponent. Here is the first stab at the notion of free and fair elections, since there are objective records of the political use of the PRF to suppress votes against Lula.
A few months before the elections, Bolsonaro sanctioned the Proposed Amendment to the Constitution No. 15/2022, which increased social spending during the election year, as well as expanded the letter of credit appropriated for the beneficiaries of Auxilio Brazil program. In other words, the Constitution was amended to make it legal to distribute money during the electoral period. Here we have the second blow against the idea of free and fair elections.
In addition, Bolsonaro tried to undermine the population’s confidence in the integrity of the digital vote-counting system. According to him, and to many of his followers, electronic ballot boxes are susceptible to fraud. These speeches have been exhaustively repeated over the past four years. As our research shows, there were 18 public speeches about election fraud and distrust of electronic ballot boxes. However, neither the TCU nor the OAB found evidence of irregularities. Not even the expected Armed Forces report was able to identify any anomalies.
Below, we present the results of an ongoing investigation into electoral fraud. Our analysis is based on a fundamental assumption: intentional vote manipulation leaves traces that can be detected by statistical analysis. That is, the accomplices of electoral fraud fail to forge results that appear to be the product of the free and spontaneous exercise of suffrage. Following international methodological best practices, we employ five different procedures. Figure 1 illustrates two of them, using as techniques the application of the Newcomb-Benford law and the “fingerprint” plot. The first technique analyzes the relative frequencies of the second digits observed in the total vote count, while the second tool compares the relationship between the turnout rate and the proportion of valid votes of the winning candidate.
One way to find suspicious statistical patterns is to examine how often certain digits are repeated in the vote count in different municipalities or constituencies for a given candidate. In fair elections, the values of the first digit, the second digit, and the last digit of the cumulative votes tend to follow a predictable distribution. According to the Newcomb-Benford law, in a set of spontaneous numbers, the first digits are more likely to appear than the last digits.
This mathematical curiosity was originally discovered by the astronomer Simon Newcomb when, while leafing through a book of logarithm tables, he noticed that the initial leaves were significantly more worn than the final ones. This numerical regularity was rediscovered by Frank Benford in a paper published in 1938. In it, Benford calculated the expected frequency of digits from a wide variety of data distributions and showed that we were dealing with a law: smaller digits appear more frequently than larger ones. Since then, this procedure has been used to detect suspicious patterns in the data.
Figures 1 and 2, for example, show that the frequency of the second digit (illustrated by the bars) is close to the expected pattern (represented by the red line) for the most-voted candidates. This correspondence between observed and expected increases confidence in the fairness of the electoral process. Techniques that focus on the first and last digits did not detect anomalies either.
Another procedure consists of analyzing the relationship between the percentage of voters present and the proportion of votes cast in favor of the winning candidate. In free and fair elections, the theory holds that vote dominance should not occur for a winning candidate to obtain the vote of all those present. This is because, assuming that abstention should vary more or less uniformly across polling stations, the vote for a given candidate is expected to be independent of the turnout rate. The “fingerprint” graph is a tool that highlights this type of trend by the accumulation of dots in the upper-right corner. If this occurs, it could be an indication of manipulation of the election outcome, as the votes of absentee voters would be artificially transferred to the winning candidate. We did not find any suspicious pattern (see Figure 3).
The forensic electoral analysis is a recent field of study and faces some challenges. It is known, for example, that strategic voting produces statistical anomalies that can easily be mistaken for deliberate attempts to manipulate the vote count. With this in mind, we employ different research techniques with the aim of increasing the reliability of the results. One issue is to corrupt the vote count by obeying a known mathematical regularity, such as Benford’s Law, for example. Another issue is to be able to cheat the system according to multiple statistical tests in an extremely short period of time, about three hours. Something that would only be possible in a fictional universe. Moreover, the public availability of the data and computer codes guarantees the transparency and replicability of our study.
In summary: we found no indications of fraud in the 2022 presidential election results. None of our forensic investigation procedures corroborate the thesis that the votes were manipulated. The Michaelis dictionary defines myth as a fantastic story that cannot be proven, usually starring supernatural beings. The mythical candidate, now defeated, does not seem to have understood that his magical fable is over.
Coauthors: Cláucia Piccoli Faganello, Pontifical Catholic University of Rio Grande do Sul (PUCRS); Pedro Cardoso Saraiva Marques, Federal University of Pernambuco (UFPE); Nelson Goulart, State University of Northern Rio de Janeiro Darcy Ribeiro (UENF); Quemuel Baruque de Freitas Rodrigues, Federal University of Pernambuco (UFPE); Bernardo Rangel Tura, National Institute of Cardiology of Ministry of Health (INC – MS); Renato Lira Brito, Federal University of Pernambuco (UFPE); Artur Quirino, Federal University of Minas Gerais (UFMG); Lucas Silva, State University Of Health Sciences Of Alagoas(UNCISAL); Ananda Marques, Federal University of Piauí (UFPI)/ Maranhão School of Public Health (ESPMA); Hesaú Rômulo, University of Brasília (UnB)/ Federal University of Tocantins (UFT); Ana Carol Aldapi Vaquera, Federal University of Paraíba (UFPB).
*Translated from Portuguese by Janaína Ruviaro da Silva


